Saturation of the PCR Survey
Saturation Curves
The completeness of the sample can be estimated using a first
order saturation model
Nnew(n) = Ntotal
[ 1 - exp(-K n)
]
where Nnew(n) is the number of distinct Hox genes
encountered after sequencing n clones. Saturation curves are
shown below:
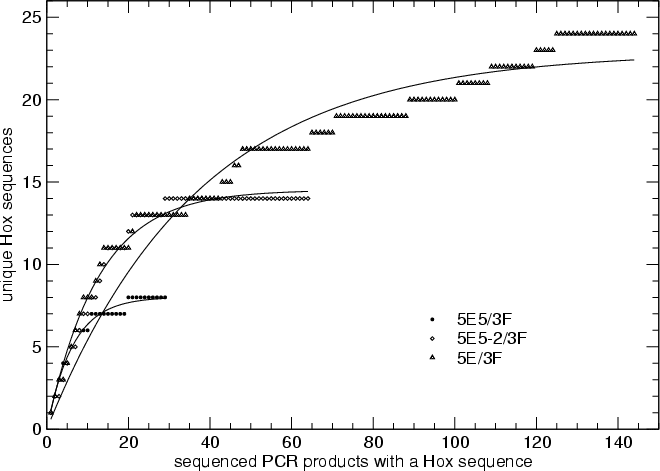
Figure. Saturation curve for the three PCR series.
Probability of Missing a Gene
The probability of missing a gene given the expected number
Ntotal of distinct genes and a sample size
of n sequences PCR products (which Hox genes) is
Prob[miss] = (
1-1/Ntotal )n
| PCR series |
n |
Ntotal |
Nfound |
K |
corr. |
chi2 |
Prob[miss] |
| 5E5/3F |
29 |
8.02 |
8 |
0.1575 |
0.988 |
2.55 |
0.021 |
| 5E5-2/3F |
64 |
14.52 |
14 |
0.080 |
0.991 |
18.15 |
0.010 |
| 5E/3F |
144 |
22.88 |
24 |
0.027 |
0.972 |
283.82 |
0.002 |
Note that the E/F series does not fit well to the saturation curve.
This was noted earlier, see also [Misof, M.Y. and Wagner G.P., Evidence
for Four Hox Clusters in the Killifish Fundulus Heteroclitus
(Teleostei), Mol. Phyl. Evol. 5: 309-322 (1996).
Summary
The survey is fairly well saturated in the sense that it is unlikely
that:
(1) any further sequences would be found in 5E5/3F,
(2) more than one more sequence would be found in 5E5-2/3F,
(3) any further sequences would be found in 5E/3F.